Water accounts
Water accounts describe primarily the physical transfers of water between the natural water resources (e.g. groundwater, rivers and lakes) and individual economic sectors. Apart from the quantities of water (in 1,000 m³/year), water accounts show the pollutant loads (in t/year) of selected emissions (e.g. nitrogen, phosphorous, heavy metals etc.) in water bodies for each sector.

The economic figures that are displayed are expenditures and funds used to finance water related activities, as well as existing infrastructure for water supply and disposal, in monetary terms (national currency).
Water accounts, therefore, provide an important basis for questions about the efficiency of water use, water productivity or the emission intensity per economic sector. Moreover, they make it possible to analyse water pricing and to assess the efficiency of investments in the water sector.
Since 2007, the basic methodology for the System of Environmental-Economic Accounting for Water (SEEAW, 2007) of the United Nations has been used for water accounting. 2008 a revised version of SEEA-Water was published.
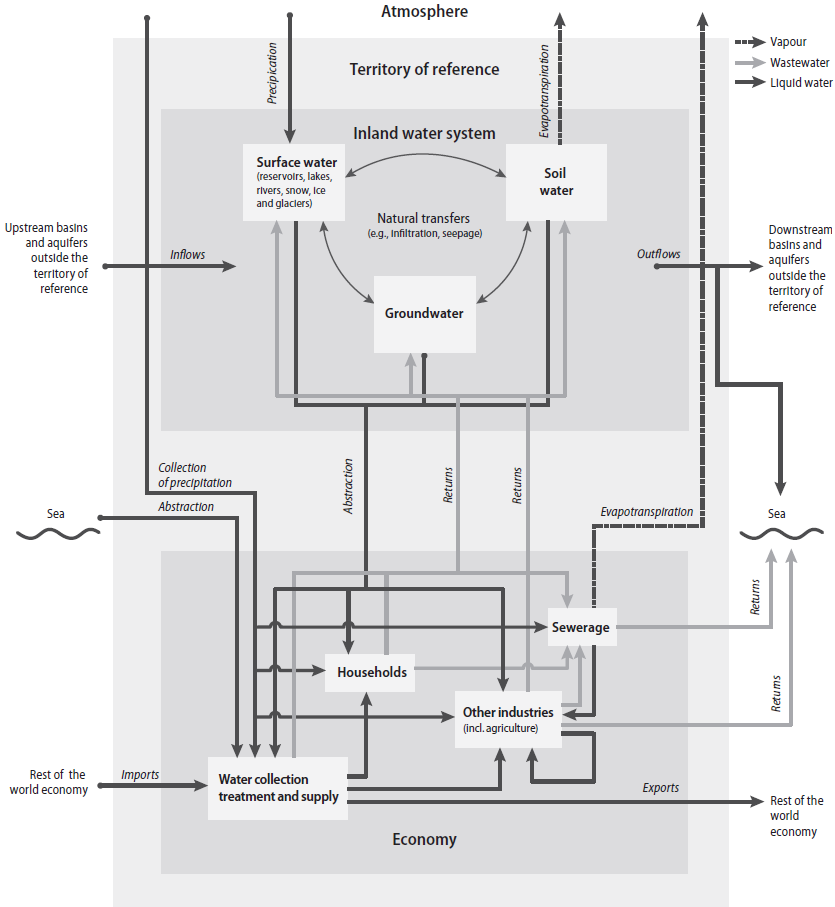
The following illustration shows the flows of the water resource system and the economy to illustrate the water flows captured by the accounts. In order to keep the figure as simple as possible, only the main flows are depicted.
A quantitative description of water flows between natural water resources and the economy, and between individual economic sectors, is shown in “physical use and supply tables". A quantitative description of the natural water resources is given in “physical asset tables”. Economic data are shown in “hybrid tables”.
Pollutant loads are accounted for by sector (and by taking company-internal or external water treatment into consideration) as net emissions in “emission accounts”, under the respective economic sectors from which they originate.

